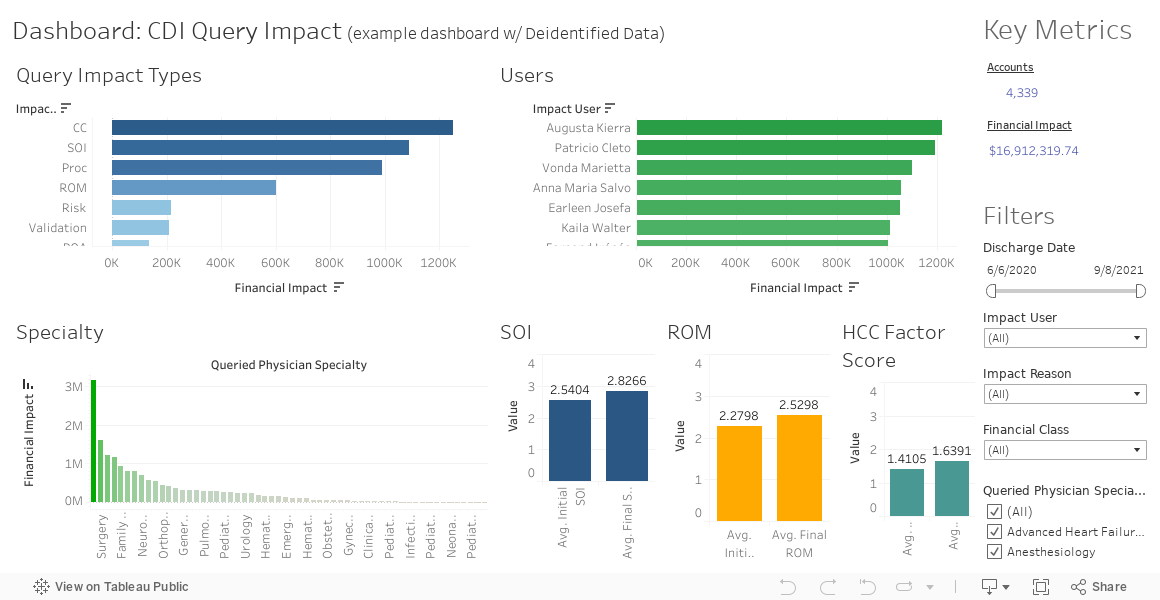
Query Impact Dashboard
Project Goal: Create an interactive dashboard in Tableau to show the financial impact of queries in differ
Project tasks:
Connect the dash to data warehouse for live interactive experience (note: data presented on this website has been pulled, cleaned and its not live)
Clean the Data
Use formula and equations to create needed columns
Make sure data is in the correct formats for analysis
Tableau
Create interactive graphs, get stakeholder feedback on needed additions and customization
This dashboard examples are based on real-world dashboard that I created.
The data has been de-identified.
The dashboard below is fully interactive!